 |
Candle Basics
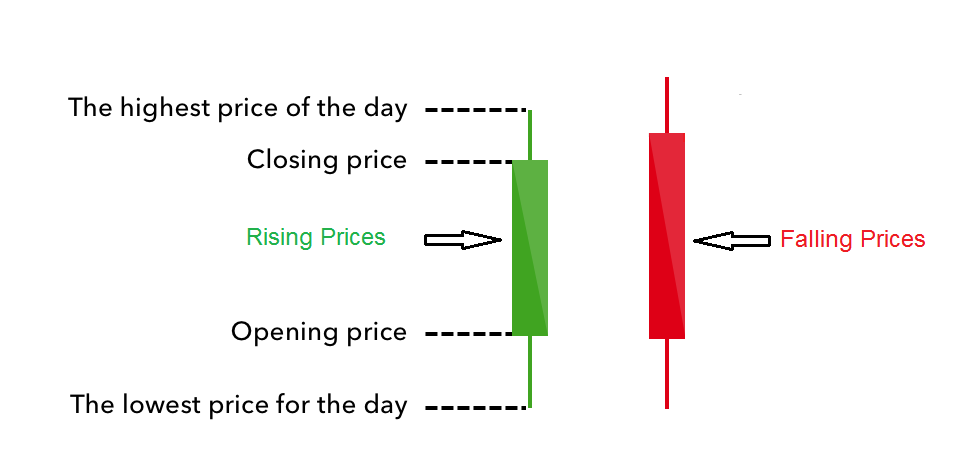
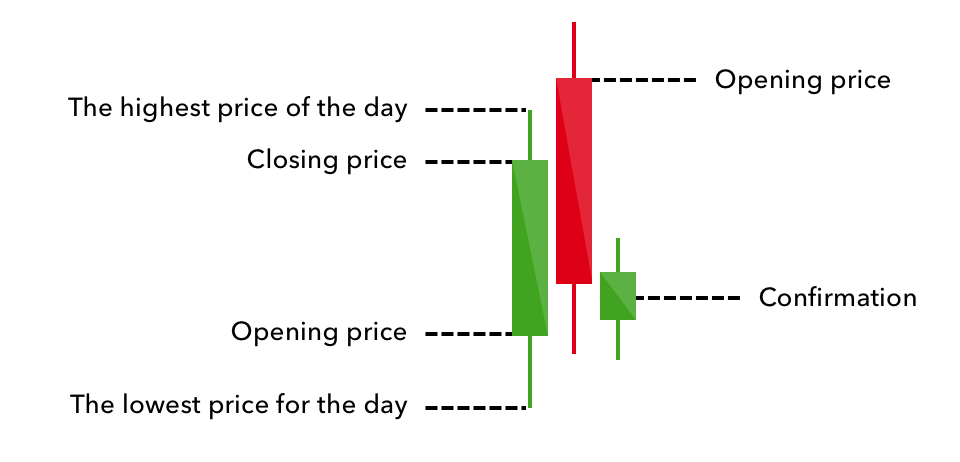
A candle has three basic features:
The body, which represents the open-to-close range. The wick,
or shadow, that indicates the intra-day or trade session high and low.The
color, which reveals the direction of market movement – a green or white
body indicates a price increase, while a red or black body shows a price
decrease. These are known as traditional candles.
|
 |
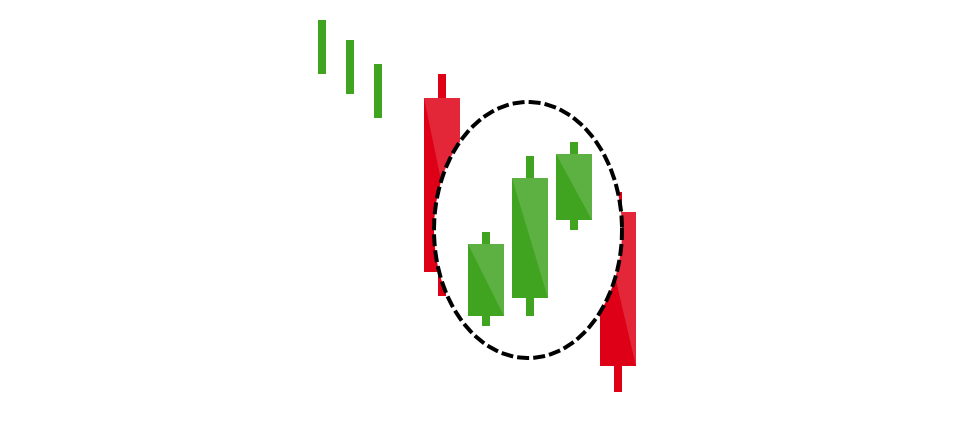
Rising Three
This is a bullish pattern, called
the ‘rising three’ candlestick pattern. It comprises of three short reds
sandwiched within the range of two long greens. The pattern shows that
despite some selling pressure, buyers are retaining control of the market. |
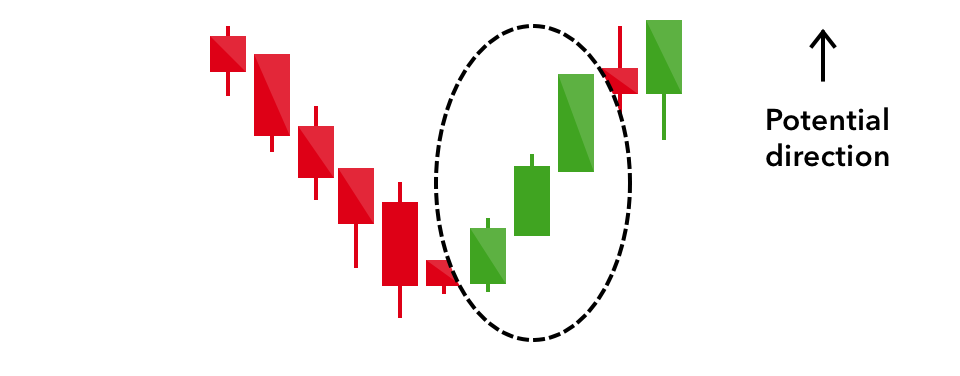 |
Three White Soldiers
The three white soldiers occur over
three days or sessions. It consists of consecutive long green or white
candles with small wicks which open and close progressively higher than the
previous day or session. It is a very strong bullish signal that occurs
after a downtrend and indicates prices are rising. |
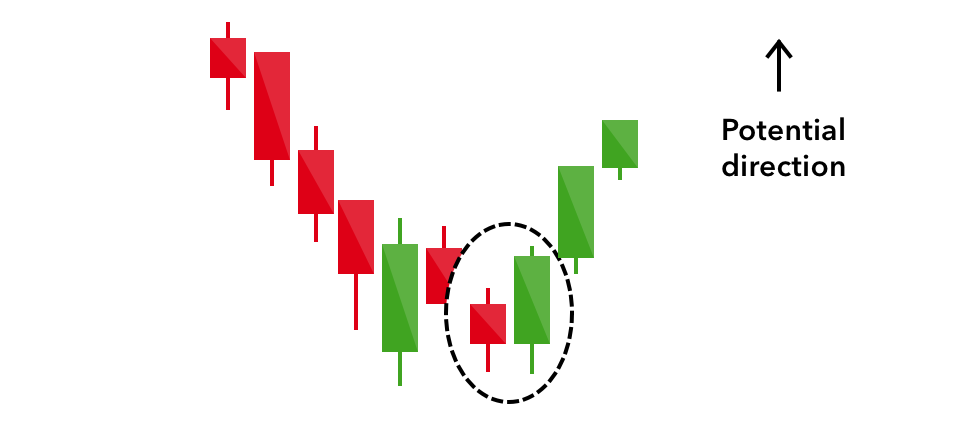 |
Bullish
A bullish engulfing pattern is
formed of two candlesticks. The first candle is a short red body that is
completely engulfed by a larger green candle.
Though the second day or session opens lower than the first, the bull market
pushes the price up and indicates prices will continue to rise.
|
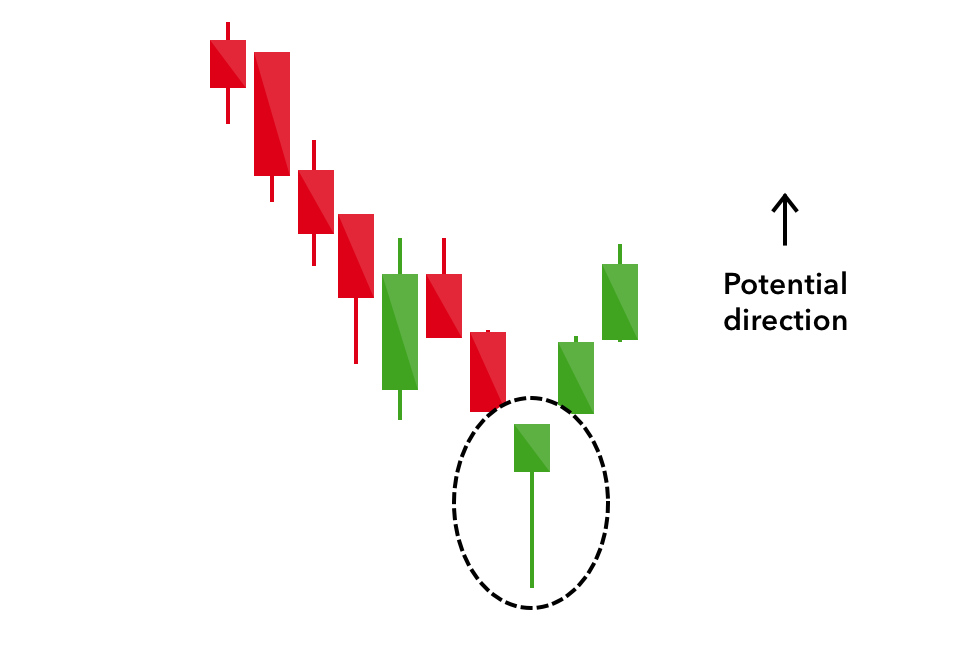 |
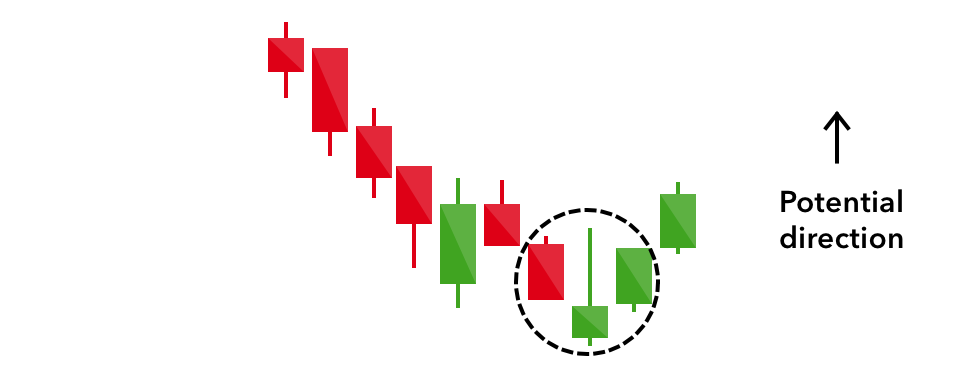
Hammer
The hammer candlestick is a short
body with a long lower wick and is found at the bottom of a downward trend.
A hammer shows that although there were selling pressures during the day,
strong buying pressure drove the price back up. The color of the body can
vary, but green hammers indicate a stronger bull market than red hammers. A
hammer is an indicator prices will rise. |
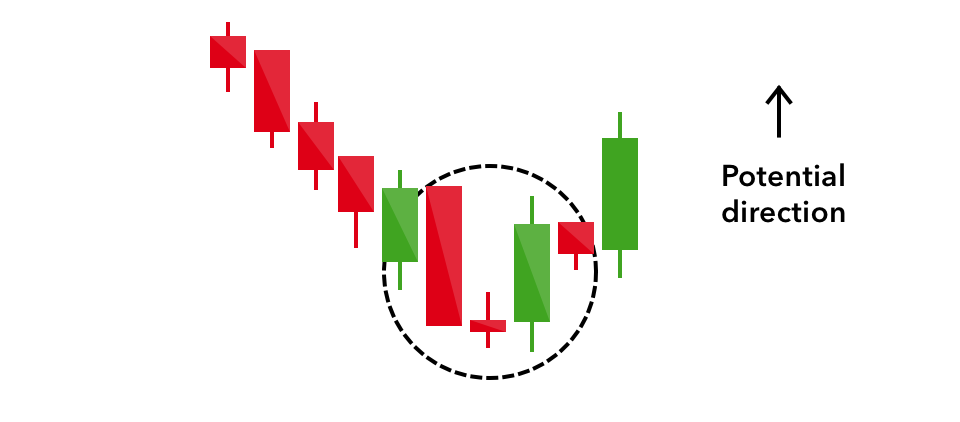 |
Morning Star
A morning star pattern is
considered a sign of hope in a market downtrend. It is a three-stick
pattern: one short-bodied candle between a long red and a long green.
Generally the ‘star’ will have no overlap with the longer bodies as the
market gaps both on open and close. It signals that the selling is reducing
and a rise in price is imminent. |
 |
Inverse Hammer
Bullish also is the inverted hammer
which has the upper wick long and the lower wick is short.
It indicates a buying pressure will raise prices and is followed by a
selling pressure that was not strong enough to drive the prices down. The
inverse hammer indicates buyers will cause a price rise. |
 |
Doji
When a market’s open and close are
almost at the same price point, the candlestick resembles a cross or plus
sign where the body is small and wicks can be any length. This is a doji
pattern indicating neither buyers nor sellers can change prices. Alone a
doji is neutral signal of market indecision, but it can be found in price
reversal patterns such as the bullish morning star and bearish evening star. |
 |
Dark Cloud
This pattern indicates a bear price
reversal – a black cloud over rising prices. It has two candlesticks: a red
candlestick which opens above the previous green body and closes below its
midpoint. It signals that prices will be sharply lower. If the wicks of the
candles are short it indicates that the downtrend was very certain. The
small green candle following confirms prices have fallen. |
 |
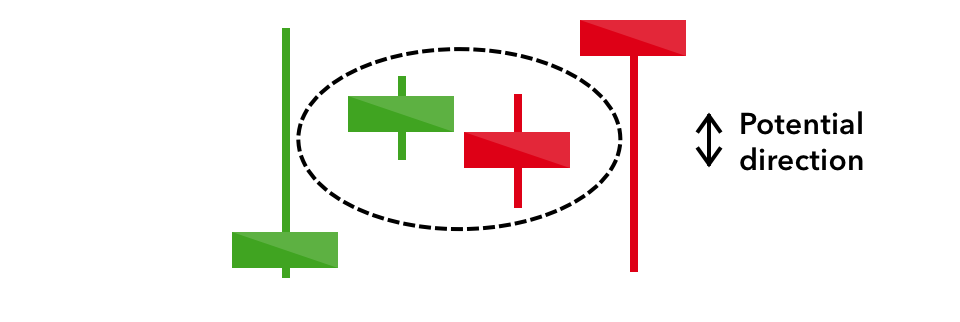
Spinning Top
The spinning top has a short body
centered between wicks of equal length. This indicates indecision in the
market, resulting in no change in price Spinning tops are a period of rest
after a significant uptrend or downtrend. A single spinning top is harmless
but can signify that the current market may change in either direction. |
 |
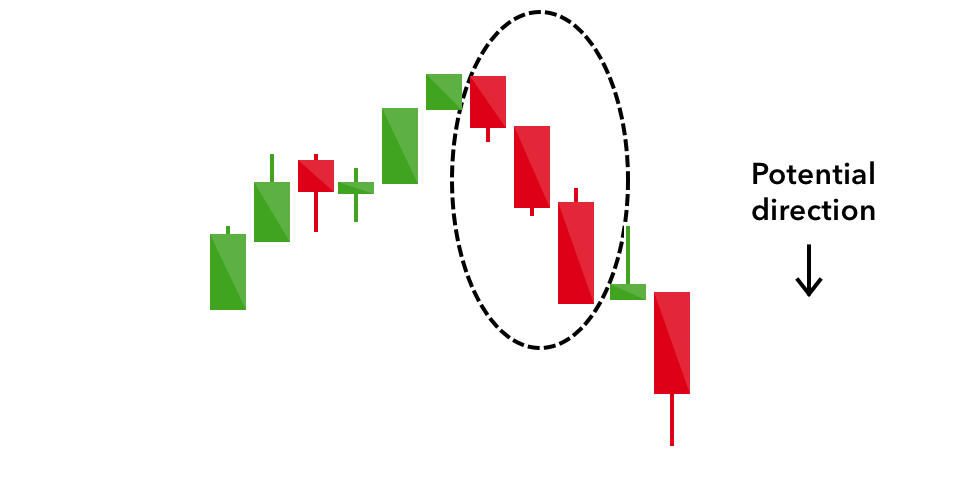
Falling Three
The falling three pattern is used
to predict the continuation of a current trend, be it bearish or bullish.
The bearish pattern is called the ‘falling three’. It has two long red
bodies, with three small green bodies between the two – the green candles
are all contained within the range of the red bodies. It indicates a very
small, weak and temporary price change. |
 |
Three Black Crows
Three black crows has three
consecutive long red candles with short or no wicks. Each session opens at a
similar price to the previous, and selling pressures push the price lower
and lower with each close. It is the start of a bearish downtrend due to
strong selling pressures. |
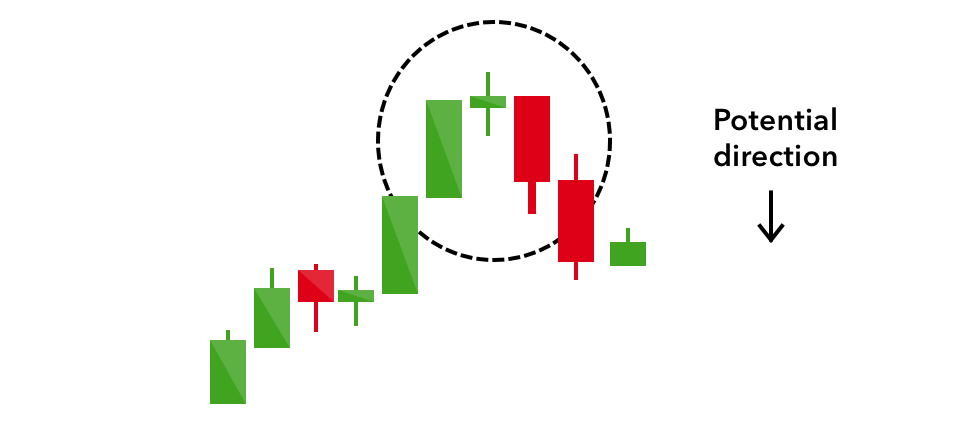 |
Evening Star
The evening star is a bearish
pattern that is the equivalent of the bullish morning star. It is formed of
a short candle or spinning top sandwiched between a long green candle and a
large red candlestick. The uptrend reverses and is particularly strong when
the next candlestick erases the gains of the first candle.
|
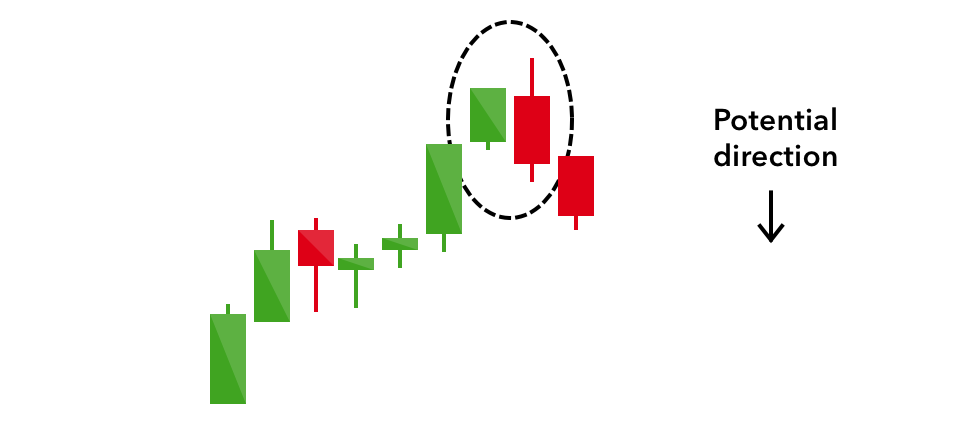 |
Bearish
A bearish pattern occurs at the end
of an uptrend. The first candle has a small green body that is engulfed by a
long red candle. It is a sign of an impending market downturn. The lower the
second candle goes, the stronger the trend is likely to be.
|
 |
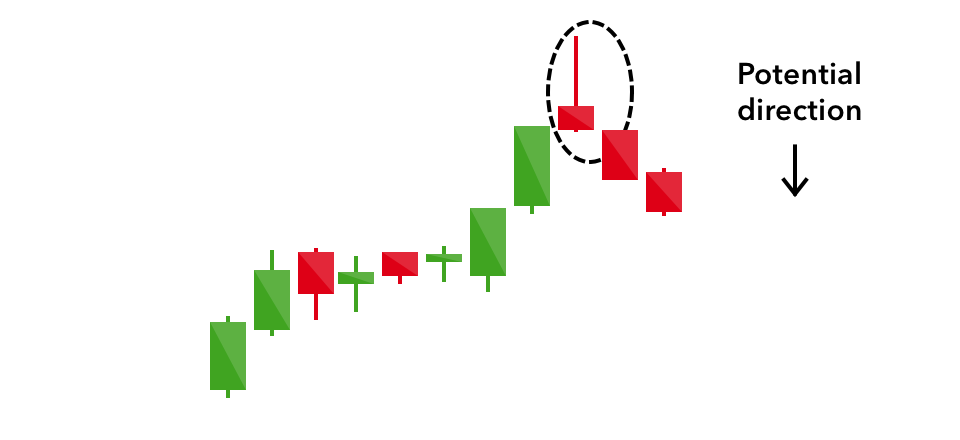
Hanging Man
The hanging man is the bear
equivalent of a hammer with the same shape but occurs at the end of an
uptrend. It indicates that there was a significant sell-off and buyers were
able to push the price up again. The large sell-off is often seen as an
indication that price will reverse to be lower. |
 |
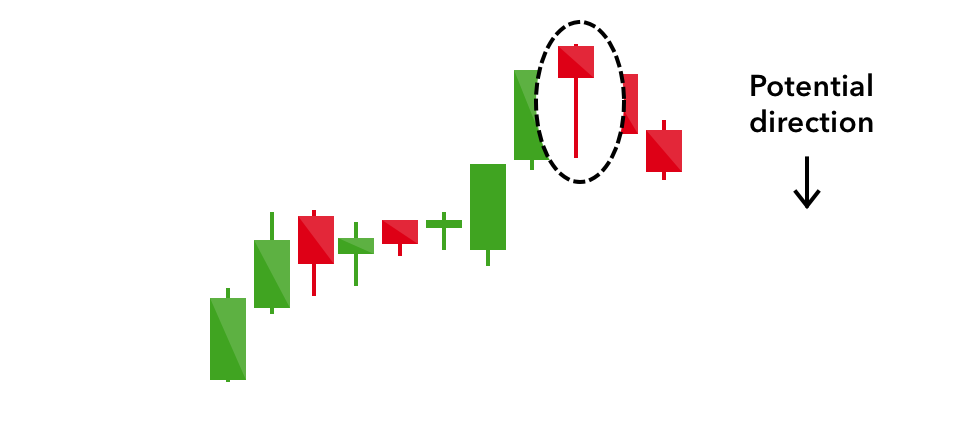
Shooting Star
A shooting star is the same shape
as the inverted hammer and is formed in an uptrend with a small lower body,
and a long upper wick. Usually, the market will rise slightly higher on
opening and to a high before closing at a price near the open like a star
falling to the ground after rising up briefly.
|
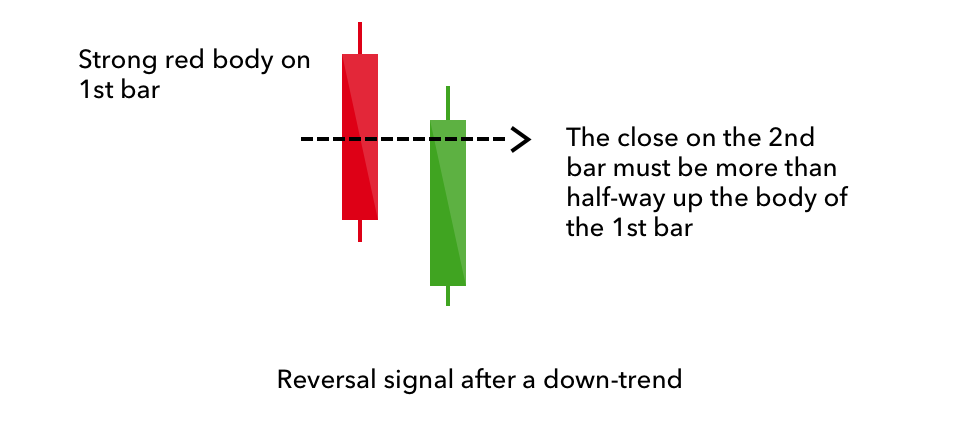 |
Piercing Line
The piercing line is also a
two-candle pattern with a long red candle and followed by a long green
candle.
There is usually a gap down between the first candlestick’s closing price
and the green candlestick’s opening. It indicates a strong buying pressure
to raise prices above the previous session. |